Westlake Analytics
Blog
1-1 Viz Help
About
Contact
Blog
Sunburst Charts Four Ways
Read more
The Journey to Visionary
Read more
Spotify Data Stories
Read more
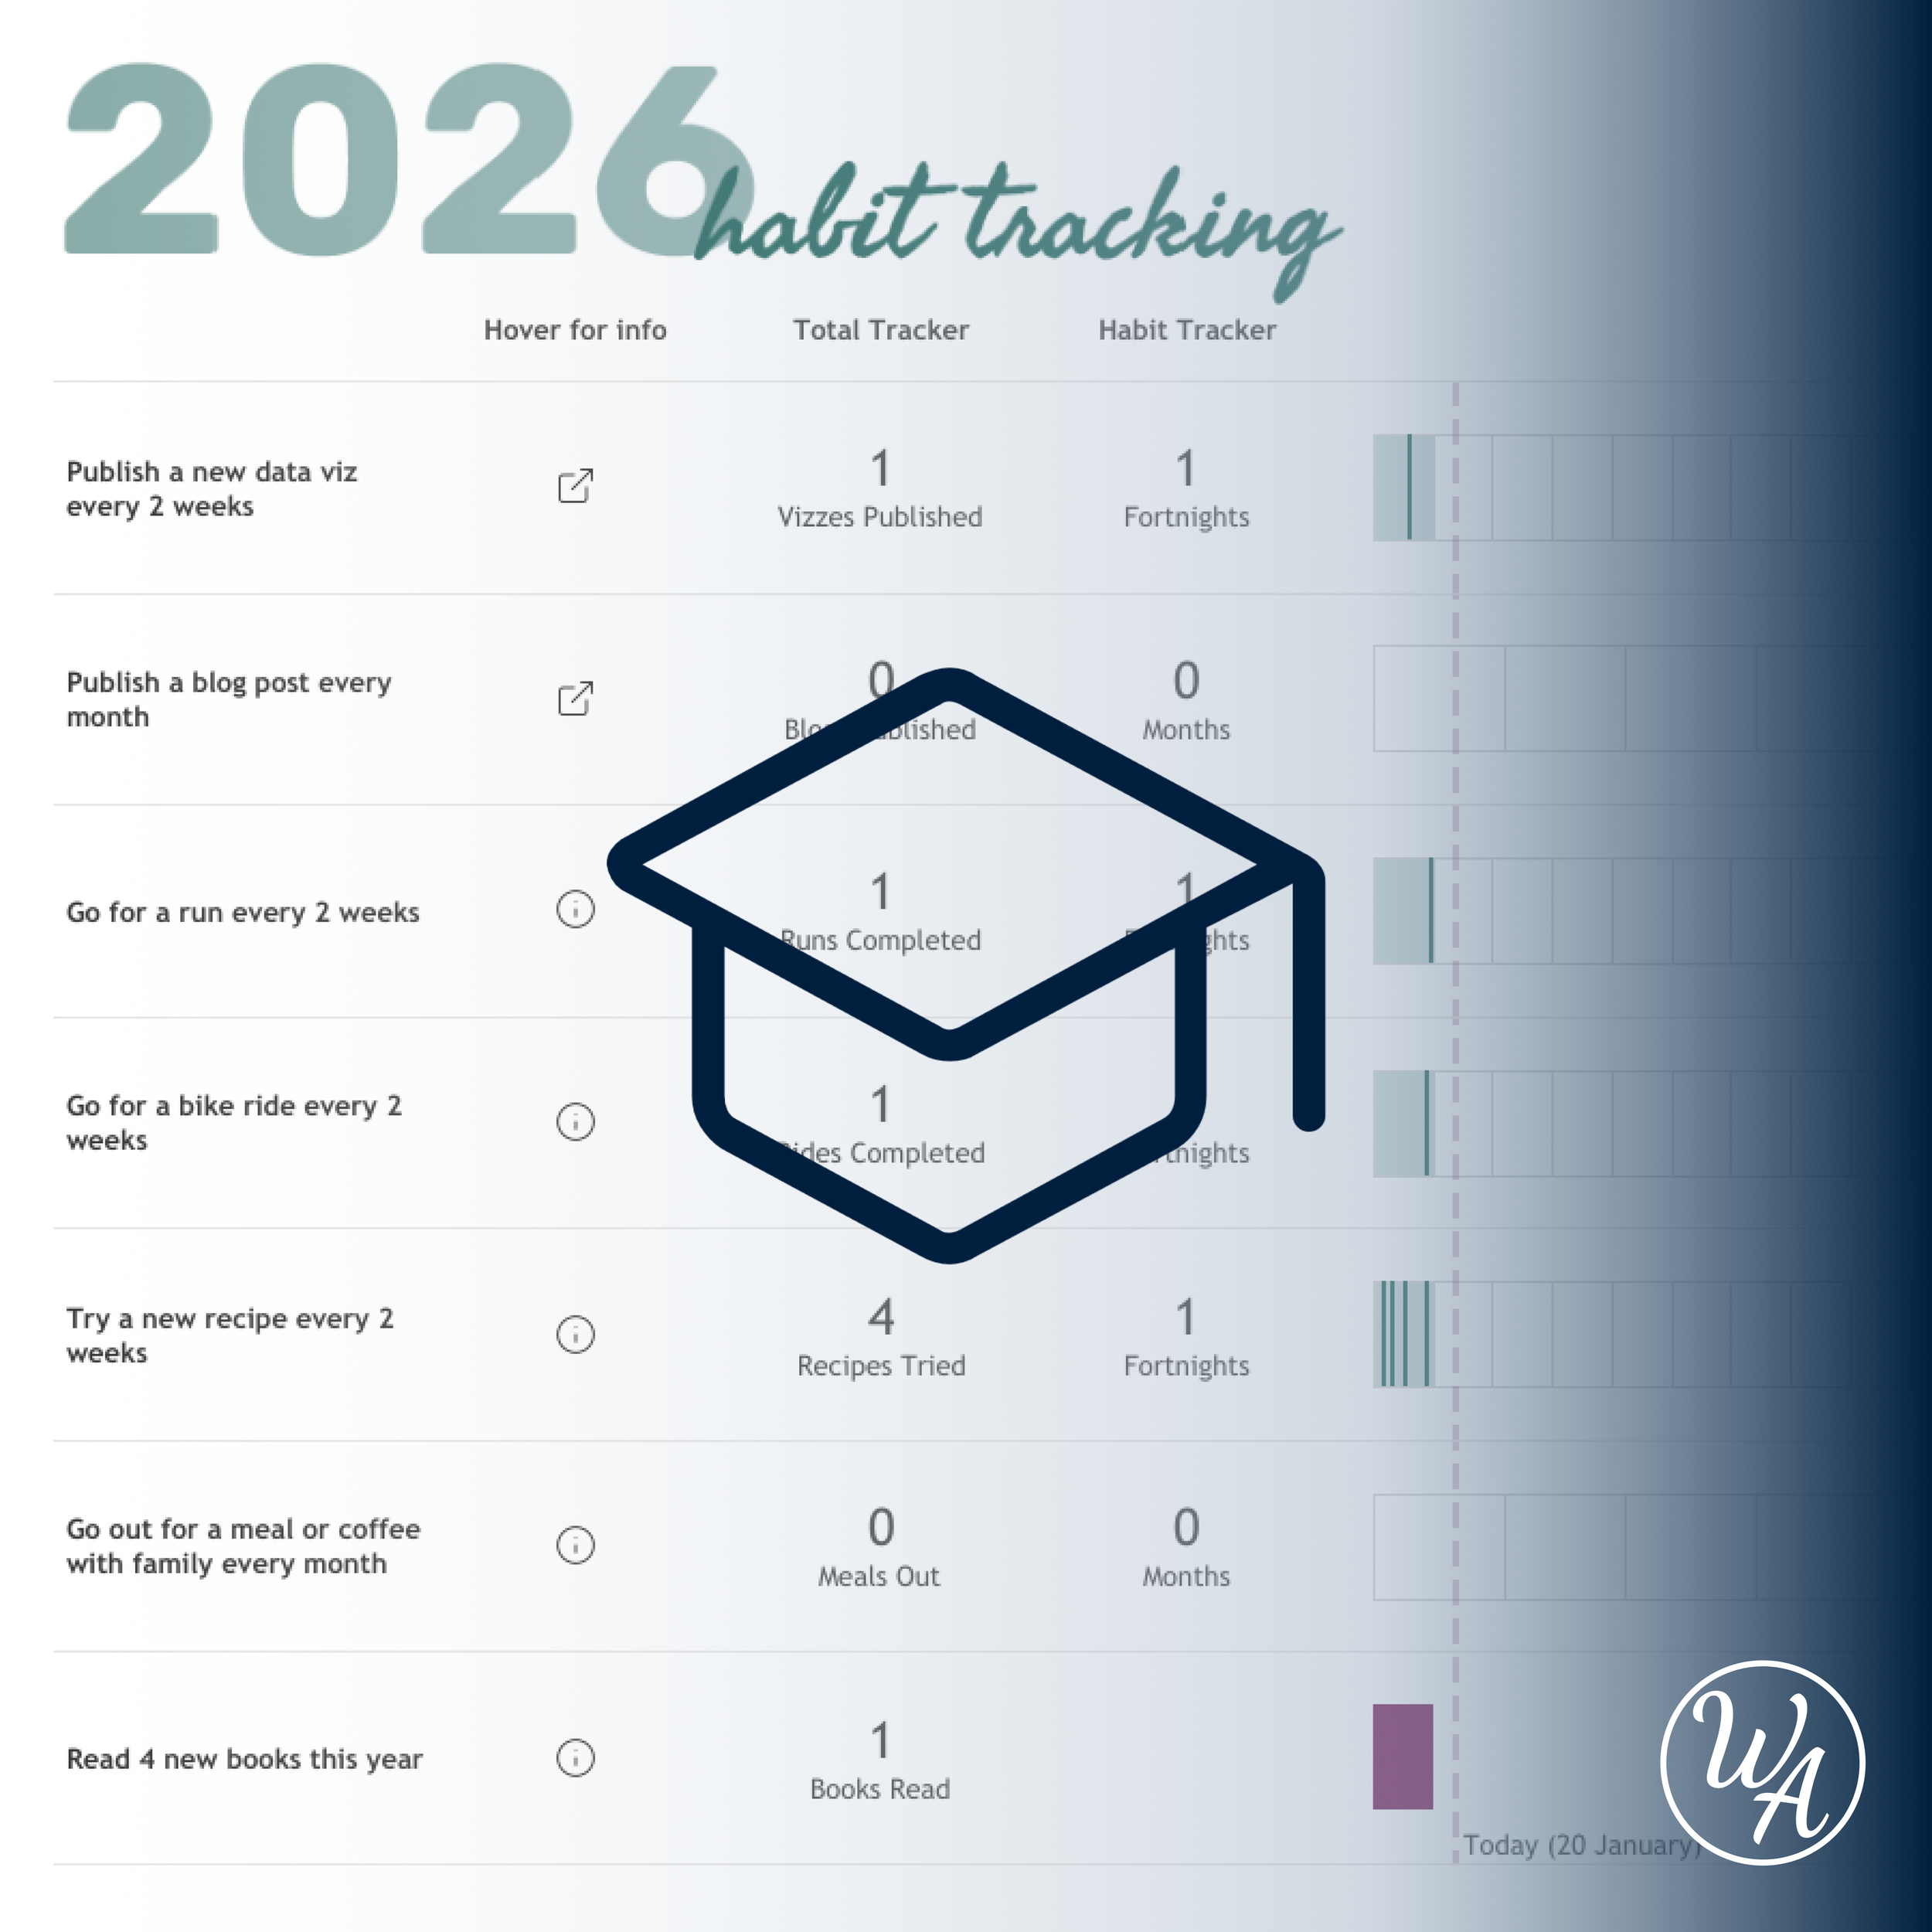
Habit Tracking | A KPI Dashboard Format
Read more
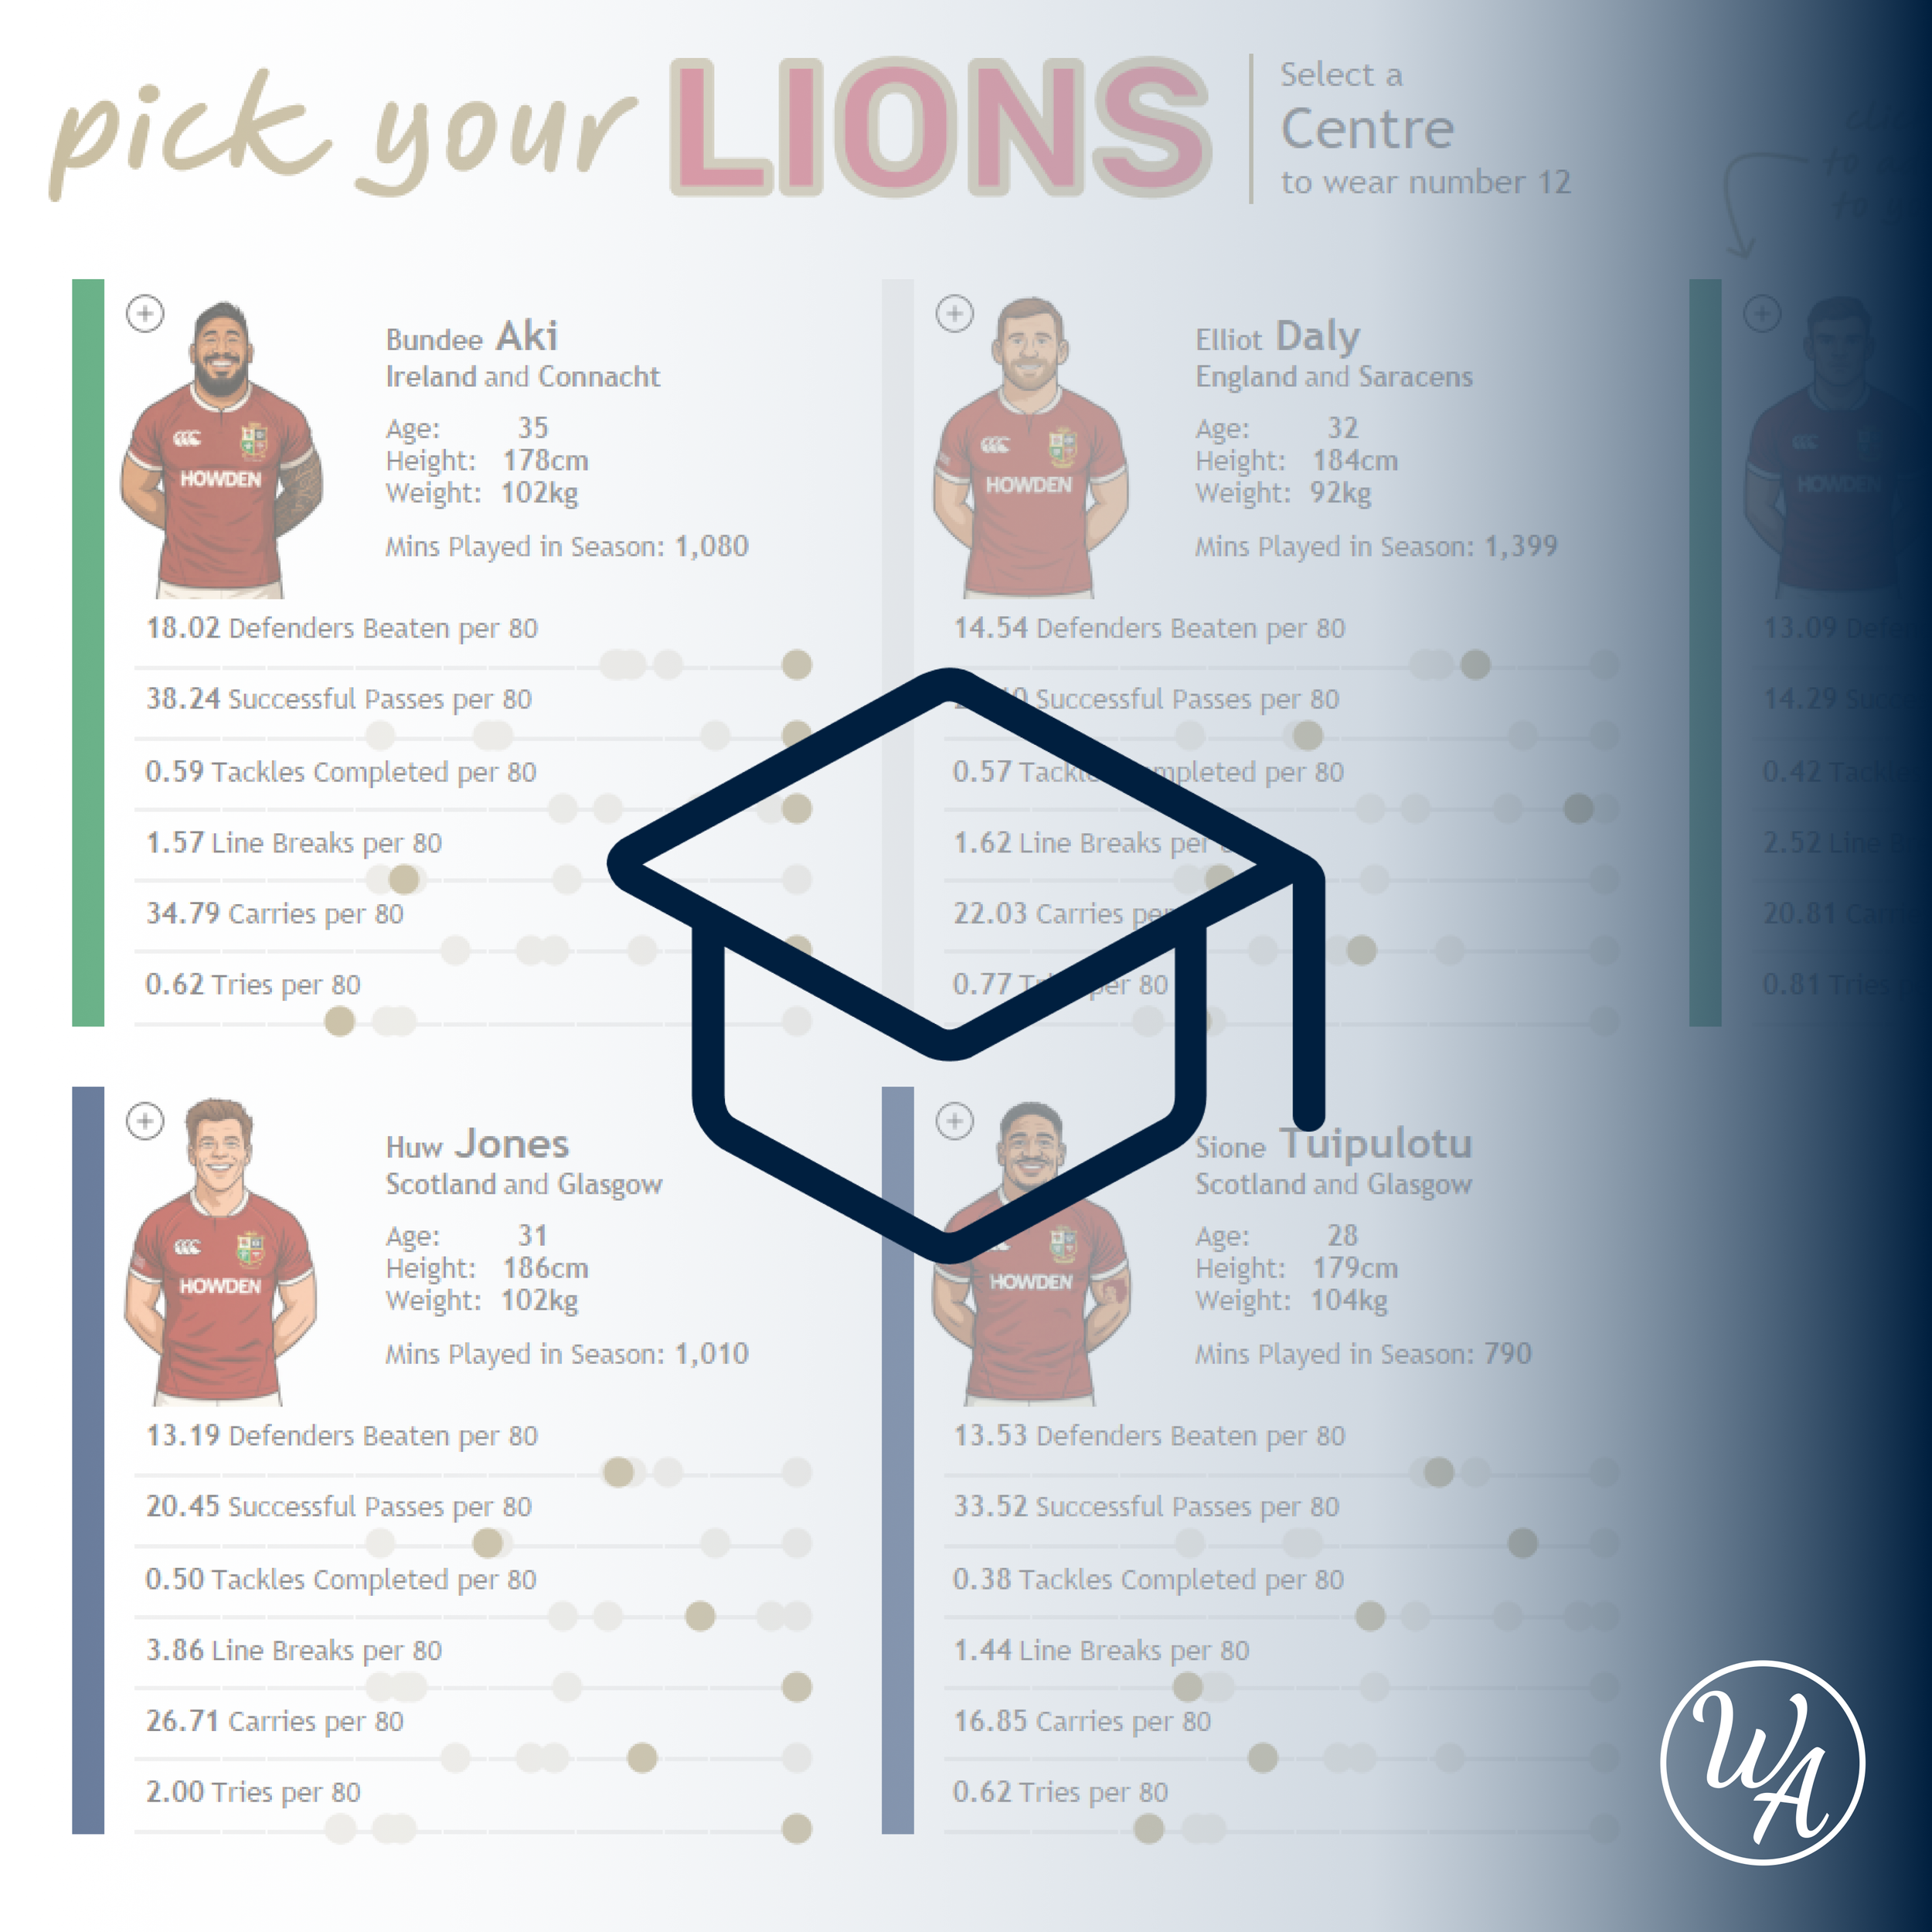
Behind the Viz | Pick Your Lions
Read more
Reflecting on TC25
Read more
Viz What You Love | Unlocking Your Potential
Read more
Creating Radial Timelines
Read more
2025 | A blank canvas
Read more
A Quick Tip | Dynamic Annotations
Read more
IronViz Qualifiers | Design
Read more
IronViz Qualifiers | Storytelling
Read more
IronViz Qualifiers | Analysis
Read more
IronViz Qualifiers | Ideas and Datasets
Read more
Creating Tartan in Tableau
Read more
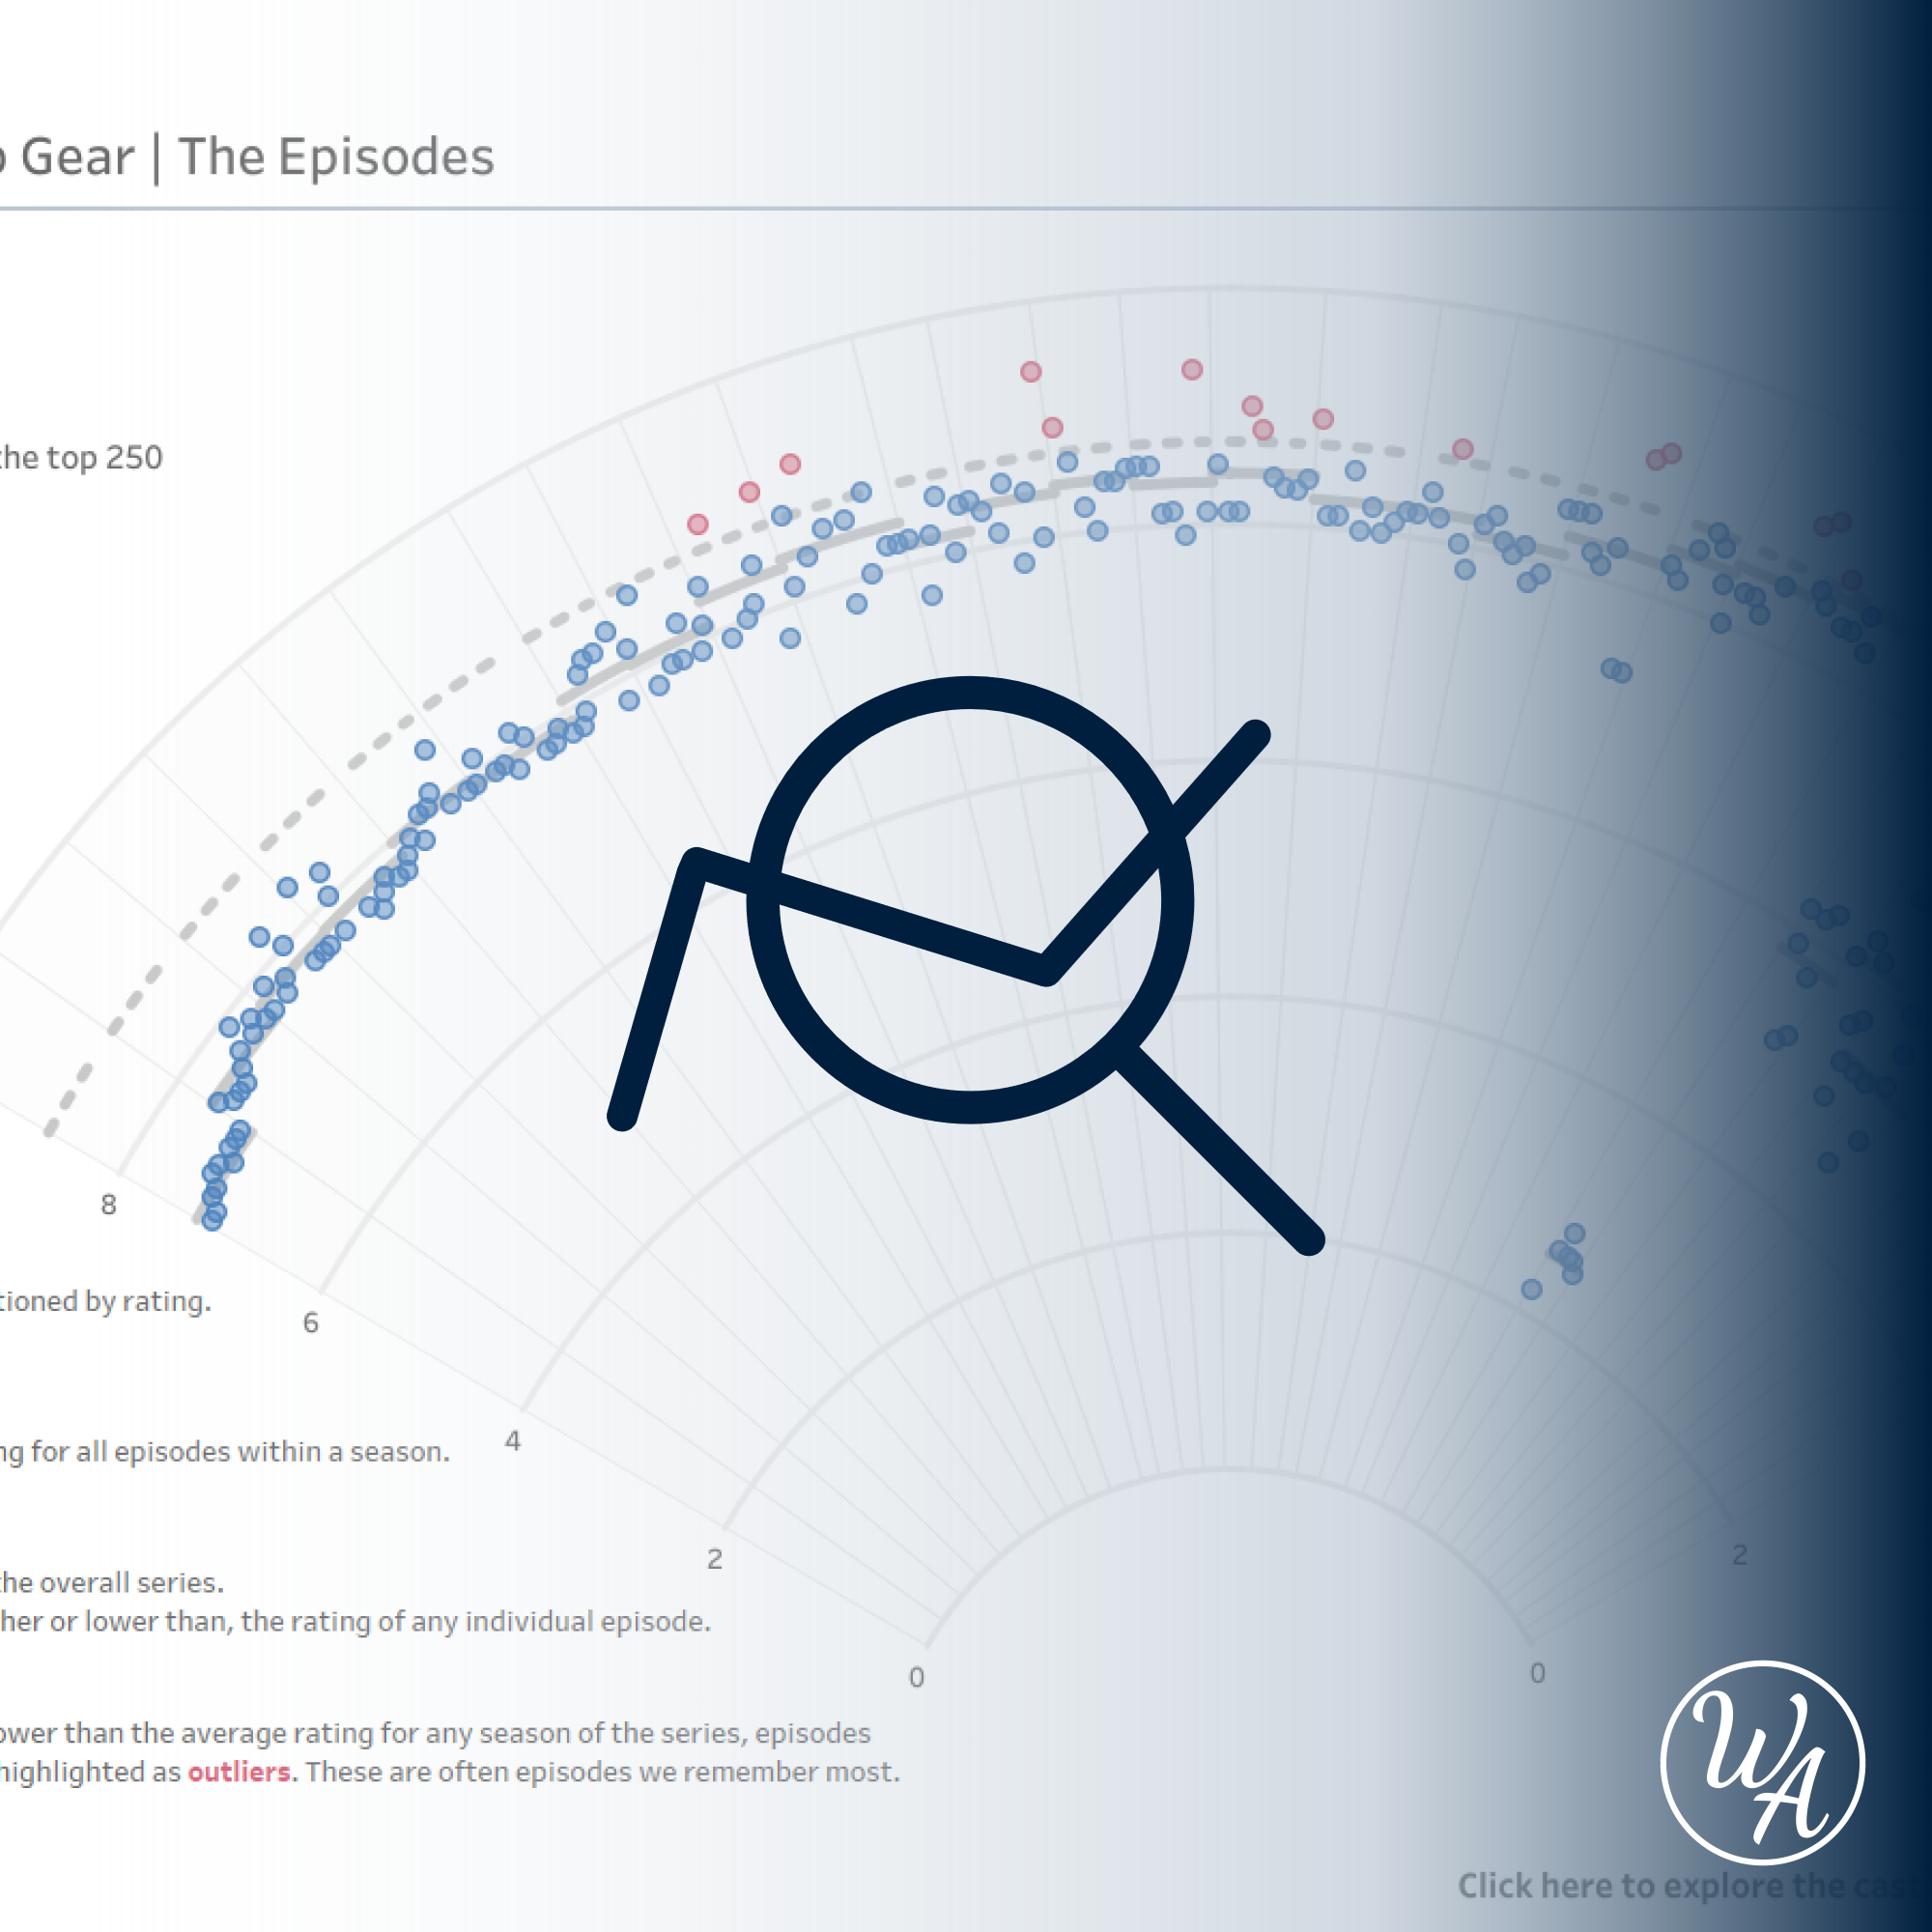
Creating Radial Scatterplots
Read more
Creating Slanted Bars
Read more
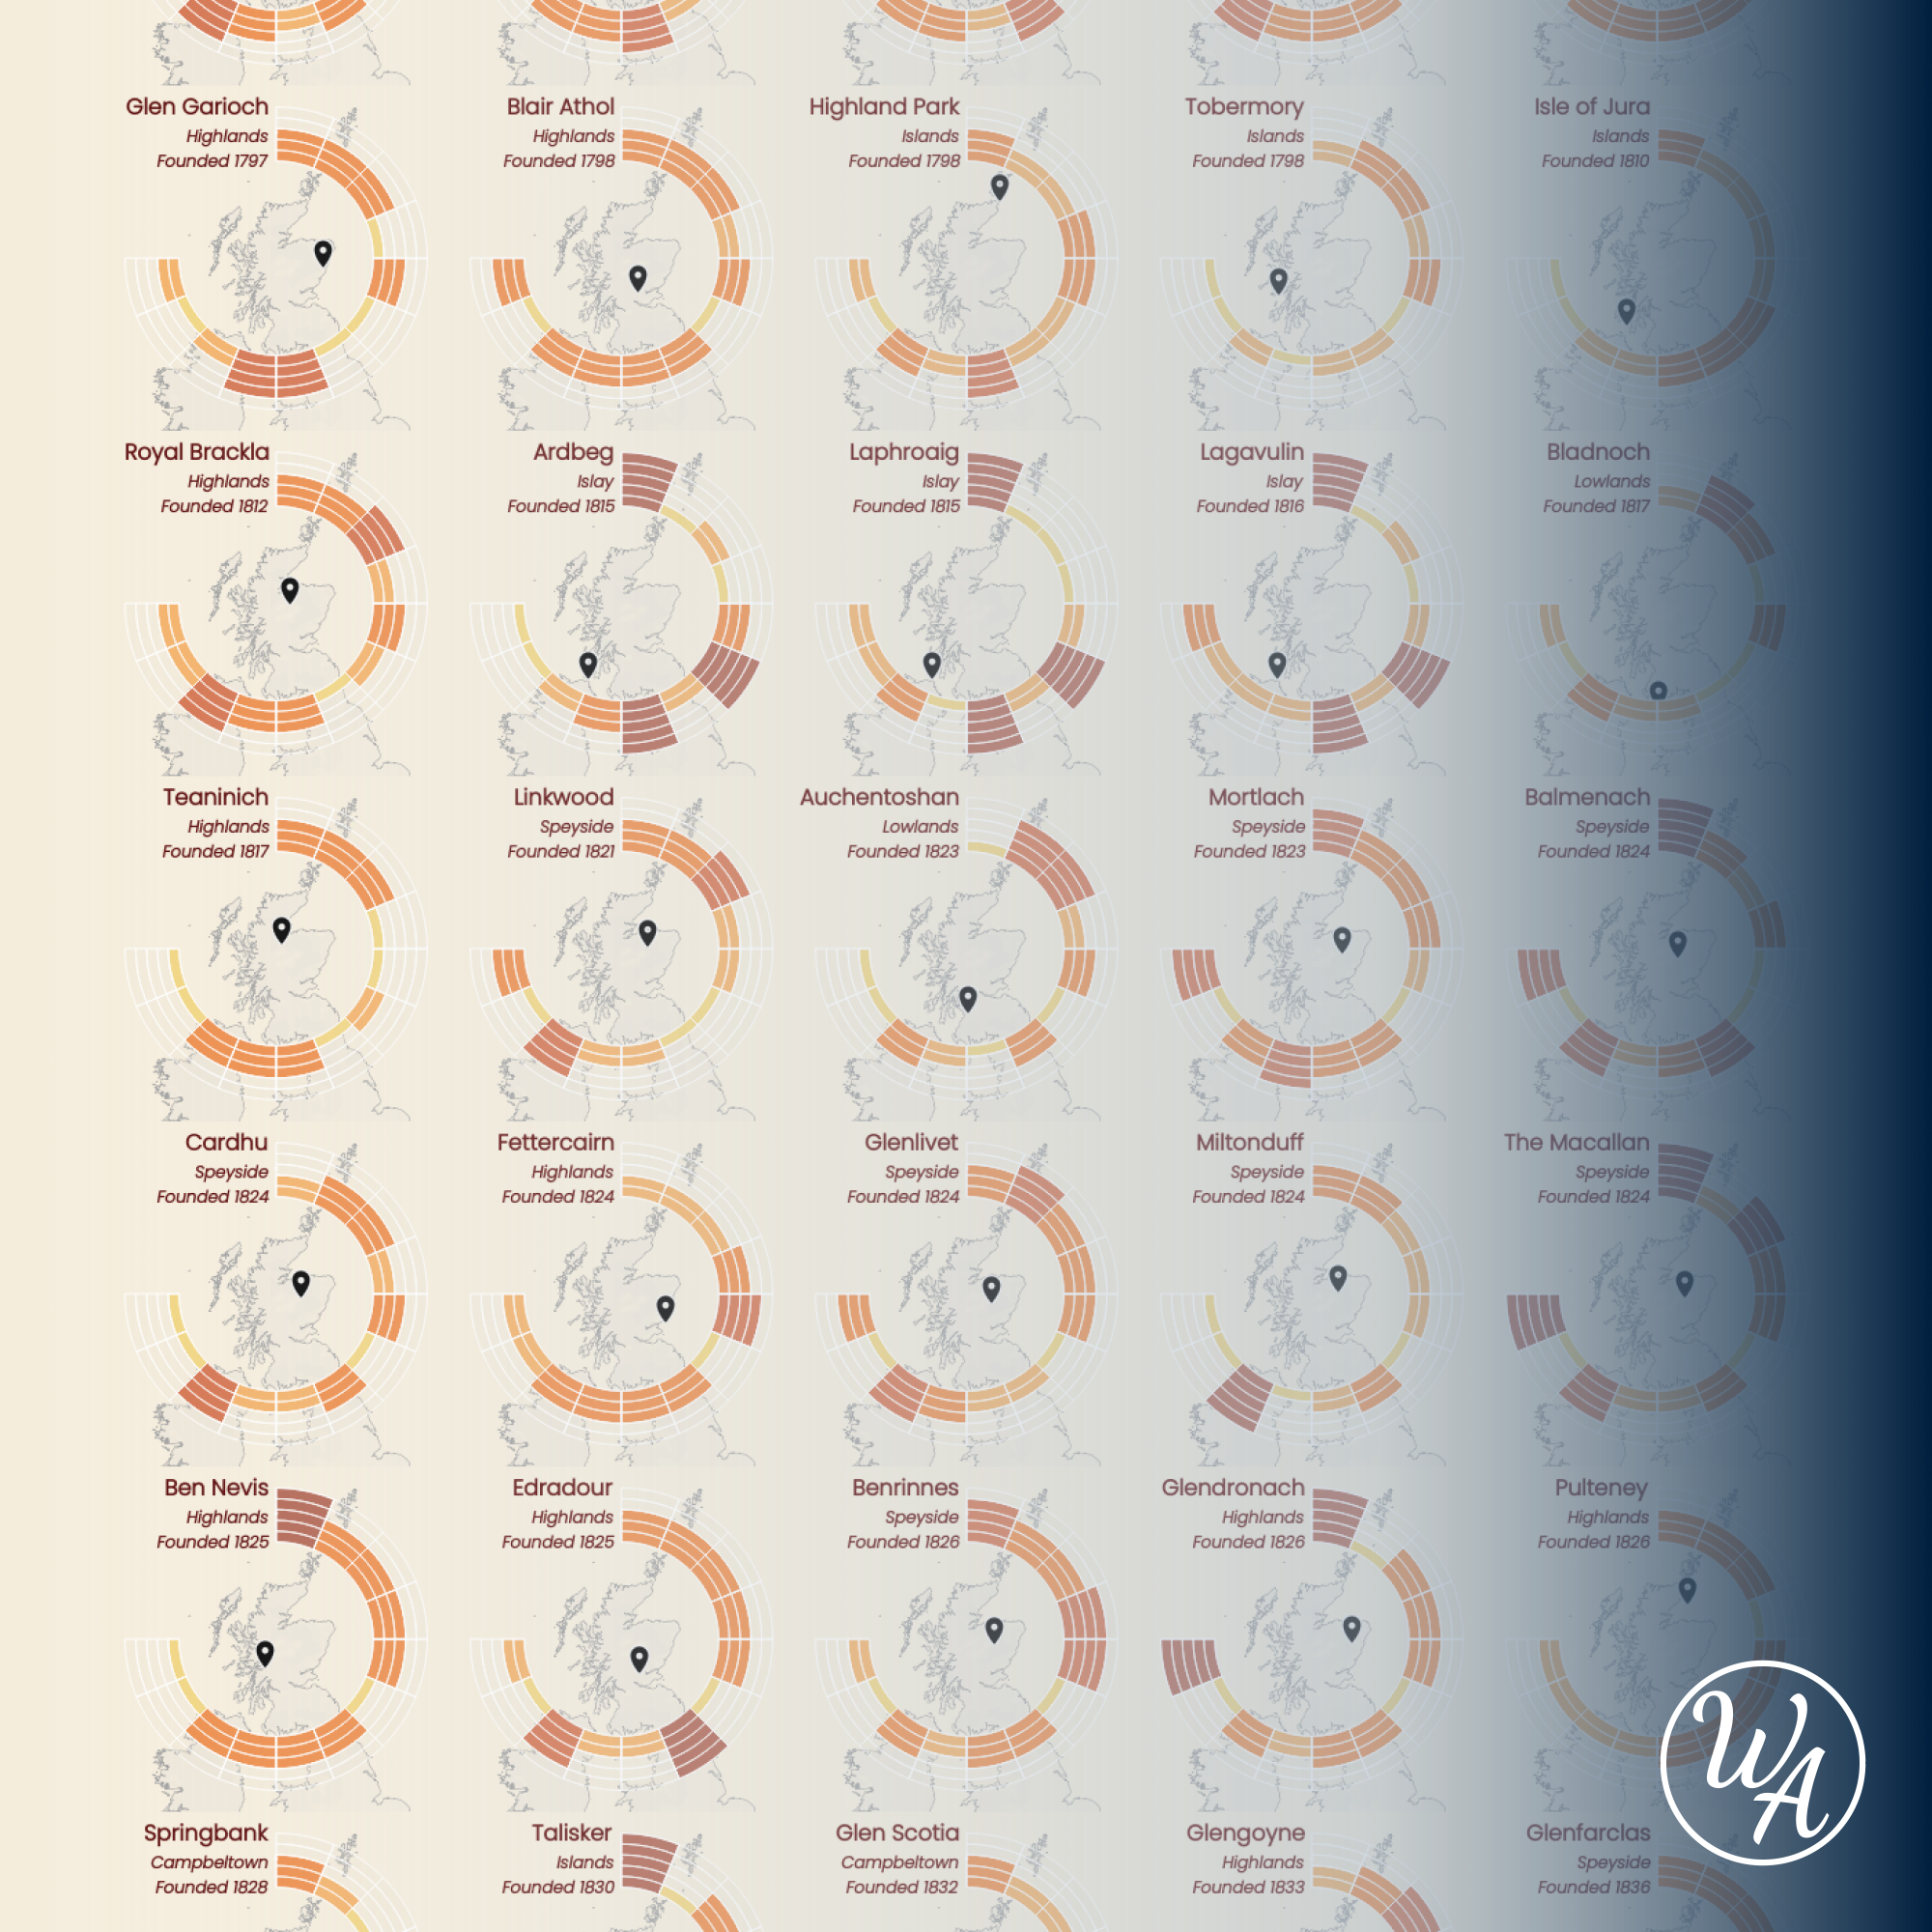
Viz Rewind | Flavour of Scotland
Read more
Viz Rewind | Visualising the Wimbledon Singles Finals
Read more
Iron Viz | A Spotlight on Storytelling
Read more
Iron Viz | A Spotlight on Design
Read more
Iron Viz | A Spotlight on Analysis
Read more
Becoming an Iron Viz Champion
Read more